Sanitation Marketing Spatial Analysis
As part of my master's thesis in Environmental Engineering, I completed a 160-page diagnostic on the spatial relationship between sanitation marketing hardware subsidies and marketplace sales in partnership with iDE's Cambodia Sanitation Marketing Scale-Up (SMSU) Program using QGIS, Excel, and Illustrator and Photoshop. This study resulted in the development of graphic systems to track and measure program progress though spatial data analysis and customized metrics (maps, charts, graphs, and animations) for 400,00+ latrine sales in Cambodia.

Sanitation Marketing
A derivative of social marketing, sanitation marketing refers to the development of the local private sector by enhancing sanitation supply and demand, by simultaneously marketing household toilets and stimulating consumer interest. The recent paradigm shift toward sanitation marketing has been primarily motivated by the failure of traditional improved sanitation strategies that focused on supply- driven interventions, specifically the provision of hardware subsidies.. Sanitation Marketing is transforming the role and perception of the rural poor by respecting, empowering, and encouraging them to participate in the market as consumers who vote with their purchases rather than as the beneficiaries of handouts.

Data Visualization
Data Visualization, a field which was previously dominated by charts and graphs, is a method of effectively combining, distilling, extracting, and translating complex data into meaningful information by identifying patterns that are revealed through visual representations. The potential and accessibility of data visualization has evolved rapidly alongside the advancements in technology and big data, and it is now standard to combine design tools and graphics programs to create beautiful and meaningful illustrations that educate and engage targeted audiences.

Temporal Analysis
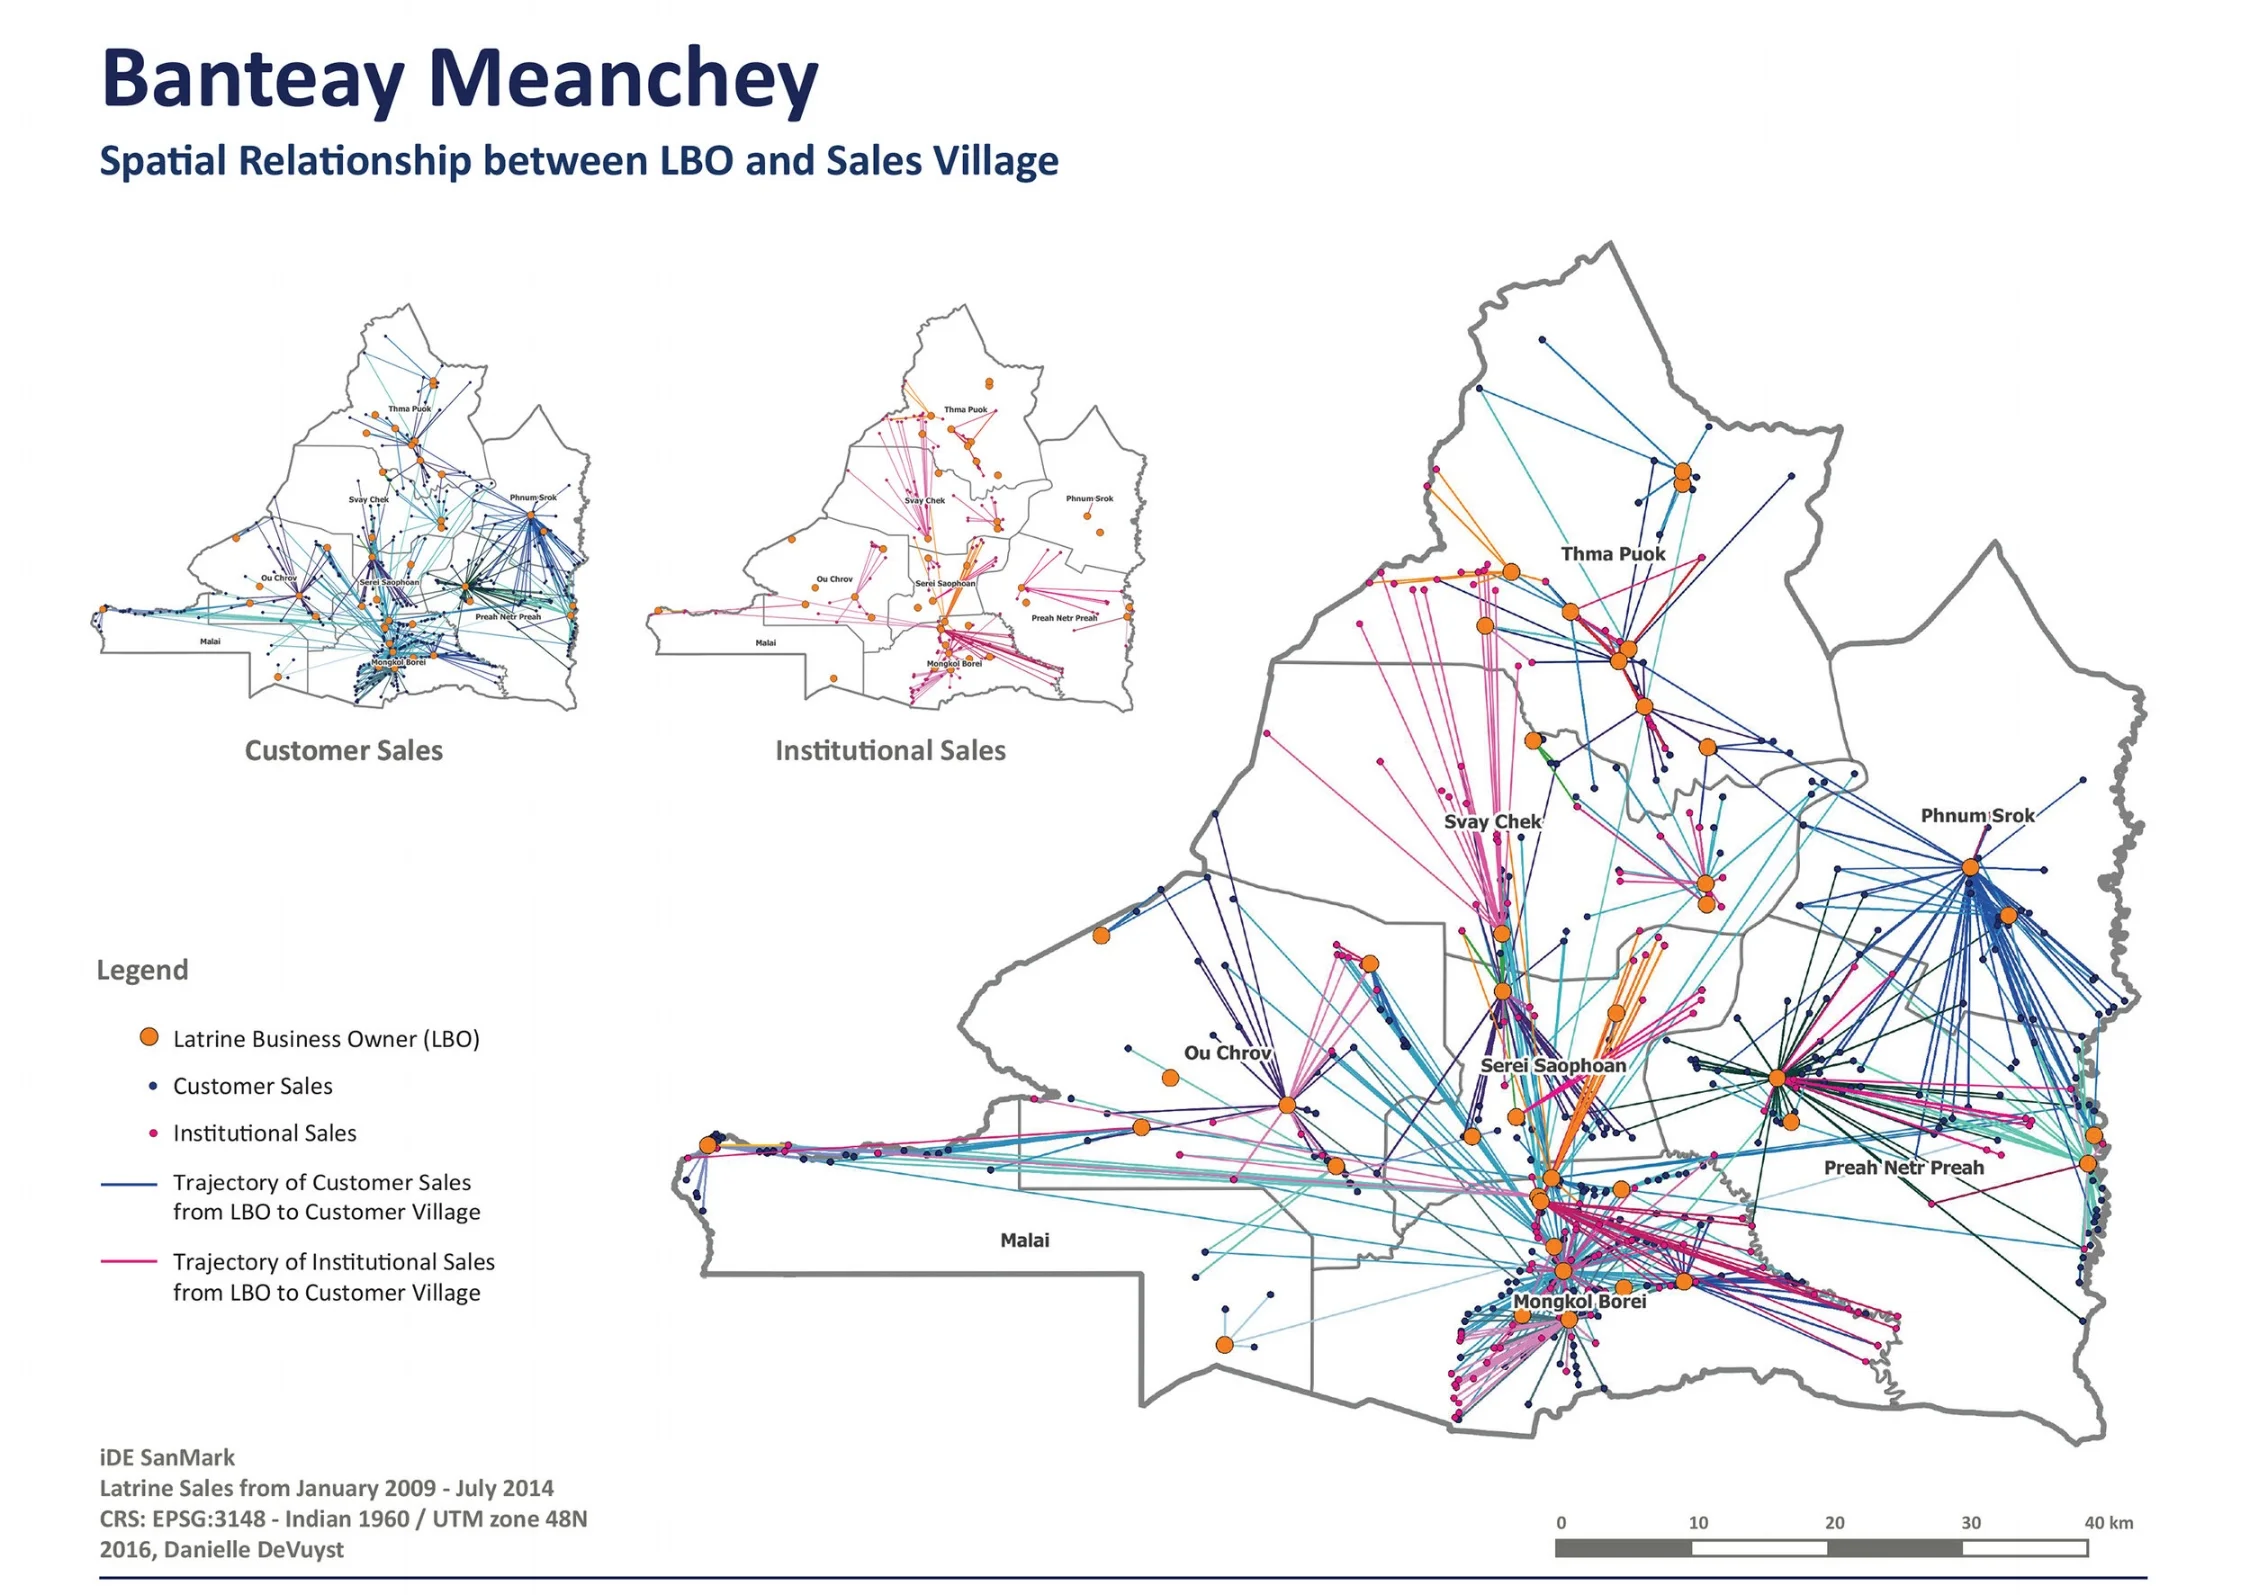
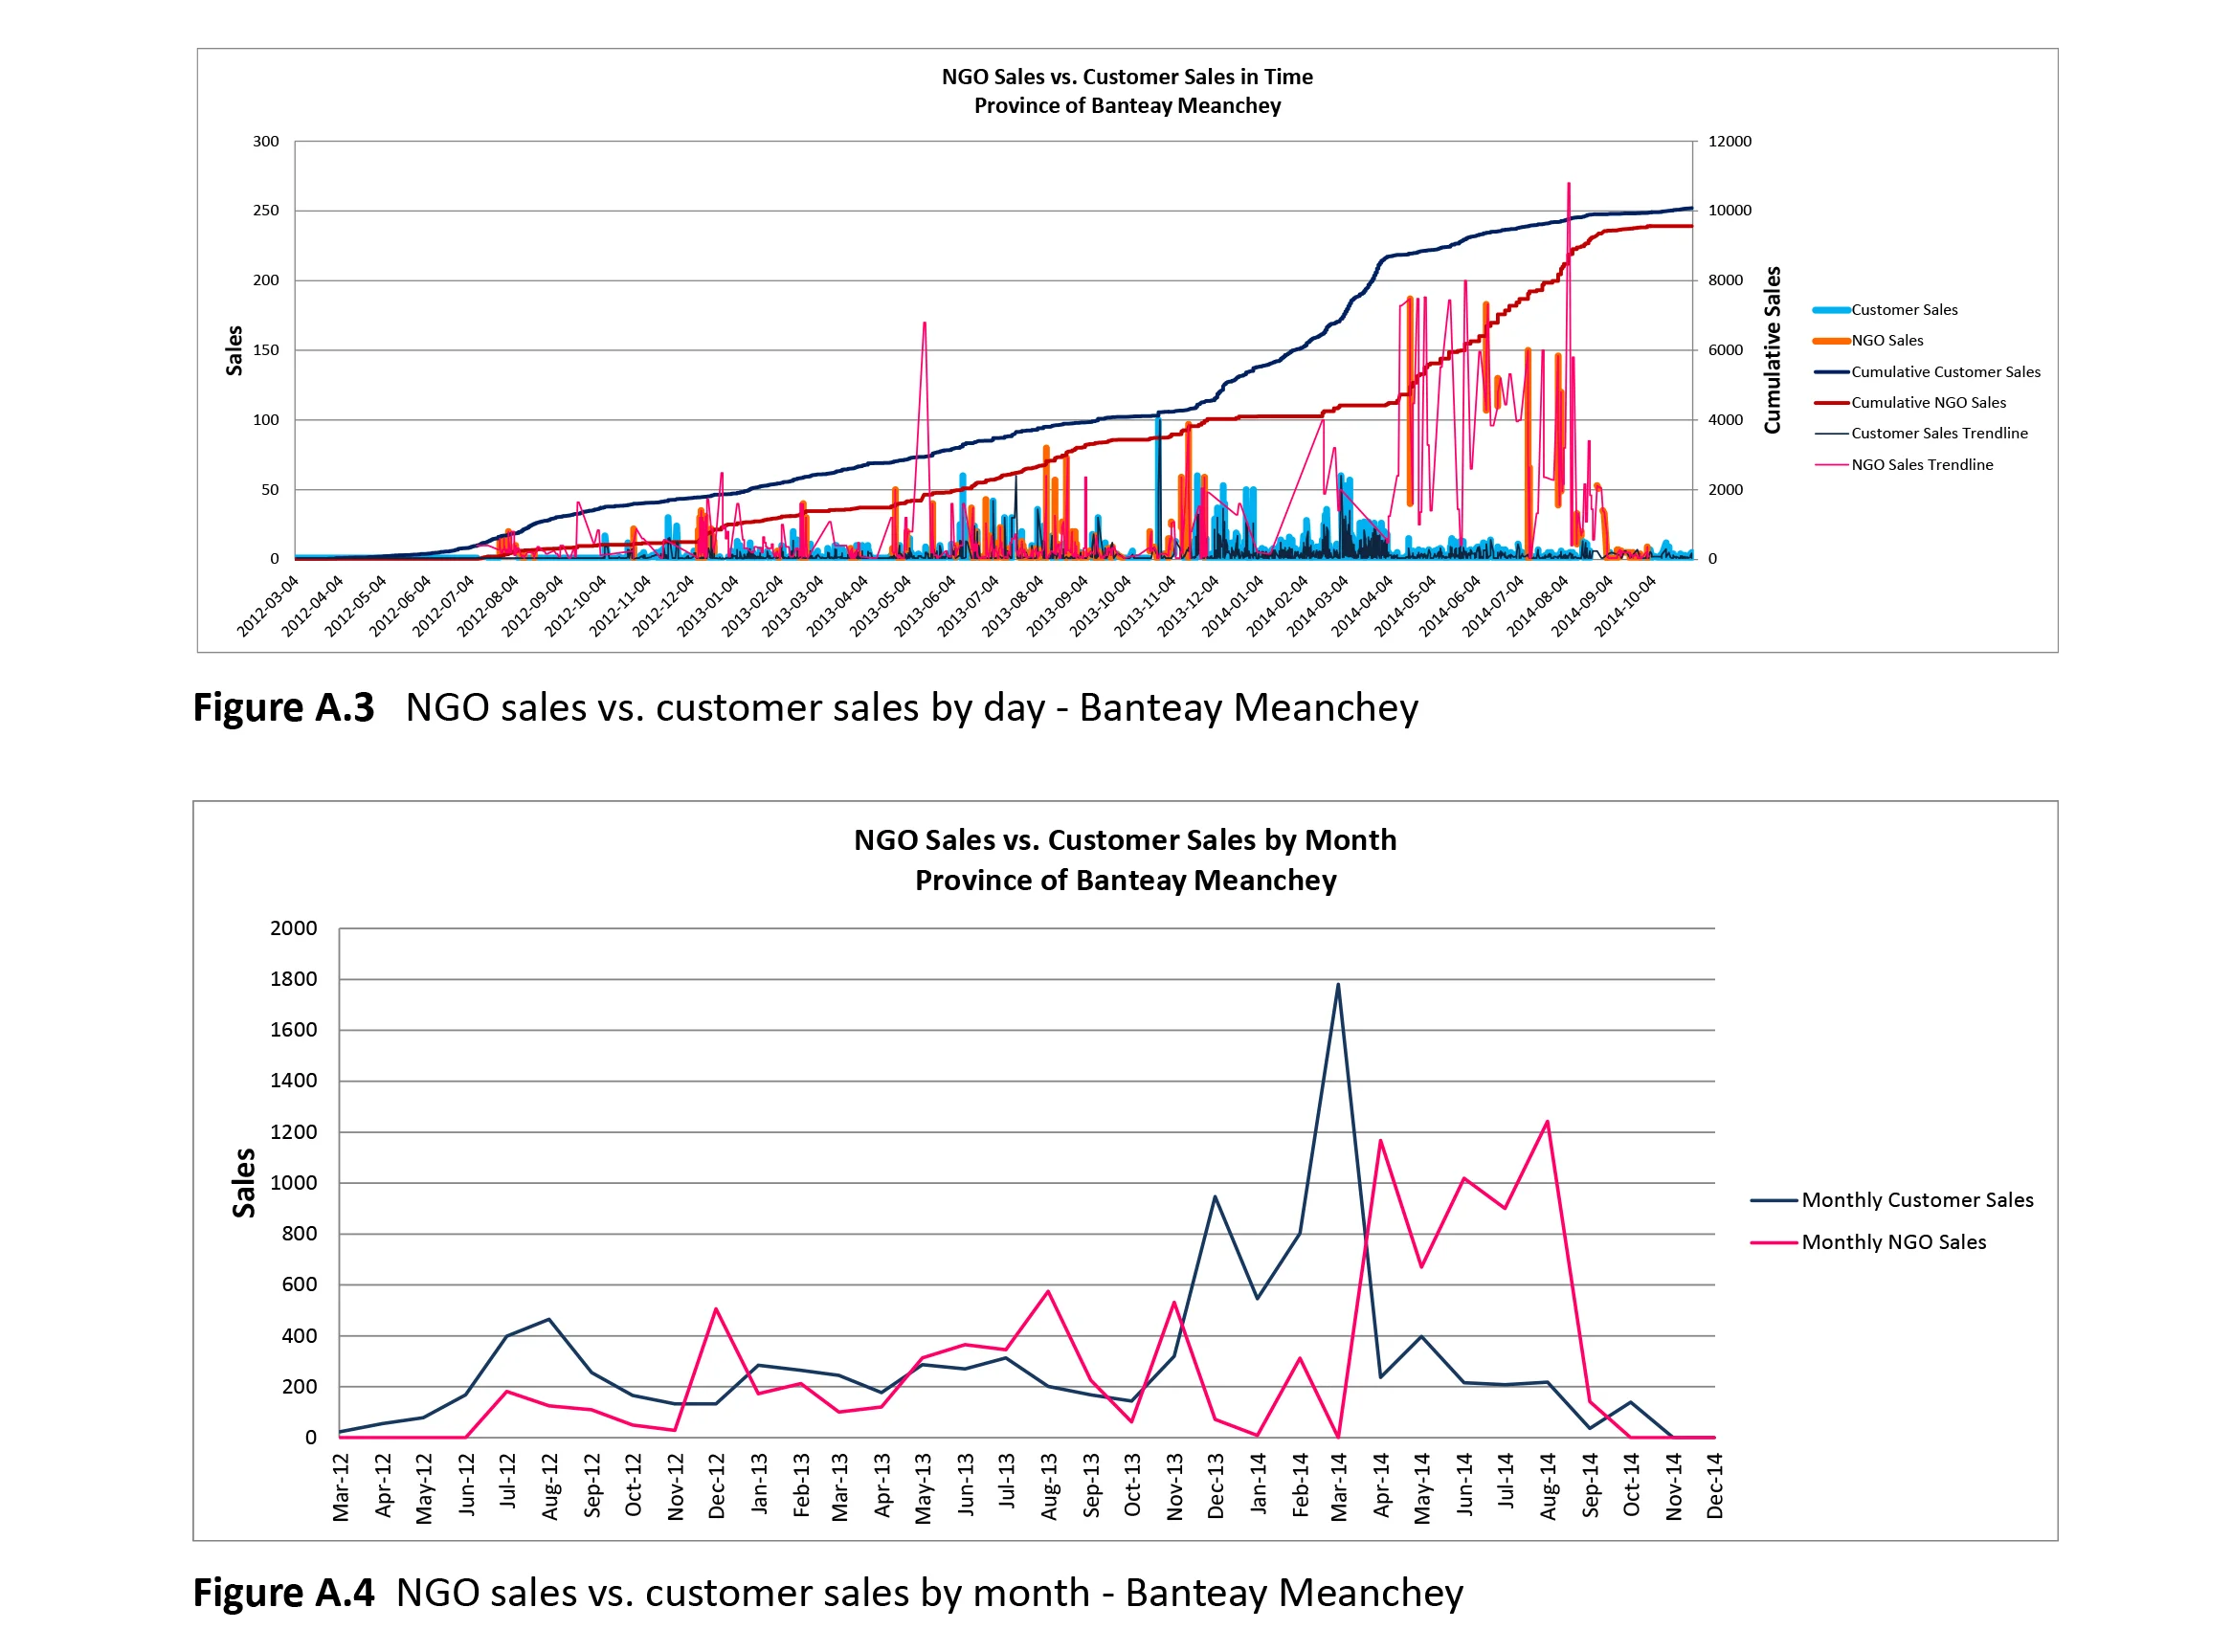
After conducting several spatial analyses to understand which type of map could most effectively communicate the correlations between customer and institutional latrine sales in Cambodia, I found that time was a crucial component to the narrative that could not be represented on a static map. To resolve this issue, I input the data into excel to see how the two latrine sales were interacting with each other over time, and then combining the spatial and temporal relationships with map animations (below).

Text